
Visualising ideas: a way to see things you otherwise wouldn’t
/By Duncan Anderson. To see all blogs click here.
Reading time: 7 mins
Summary
I’ve found visualising thoughts is a core way to level up my ability to communicate. A picture / visualisation tells 1,000 words
I’ve found visualising thoughts is a core way to level up my ability to problem solving (AKA visualising into a model IS problem solving)..
They teach you to read, write and do basic maths at school. IMO they should teach you to problem solve and communicate in visuals. I believe learning to problem solve and communicate in visuals has massively improved my life... not just work!
Jingle: visuals, not just pretty, a way to increase the beauty of your work!
In some respects: your ability to problem solve = your ability to visualise problems
Visualising a problem space almost always helps me see a problem in an orthogonal way and as such, new possible solutions. It honestly feels like a magic trick.
“We cannot solve our problems with the same thinking we used when we created them.” Albert Einstein
For me, thinking visually is thinking in a different way. Thinking in a different way normally allows me to find new and different solutions.
*Aside: in education academic research IMO they’d call thinking in visualisation a form of ‘abstract reasoning’. Developing abstract reasoning skills is a core way to increase creativity and problem solving.
So… want to come up with a cool new idea? Try visualise the problem!
I can't fly. If you were to ask me to make a visualisation in the past, it was like asking me to fly. Slowly over time I've been able to get better at visualising and am flying to new heights.
I used to think that making visualisations was the preserve of geniuses. Now I think making a visualisation is the way to have a genius insight.
Levels of visualising:
L0: can’t make visualisations of idea
L1: can modify existing visualisations you have encountered
L2: can join together two different visualisations you have encountered
L3: can make custom visualisations
Comment
When people are starting to build visuals to develop their ideas I normally say ‘pick one of the categories below and apply it to your problem’. Slowly over time people become proficient in more and more visual models and then start making their own models!
“Learn the rules like a pro so you can break them like an artist.” Piccaso.
Examples of visualisation (see the actual visuals below):
Continuum
Multiple continuums
Golden mean (the middle is good and edges bad)
Table
2x2
Concentric circles
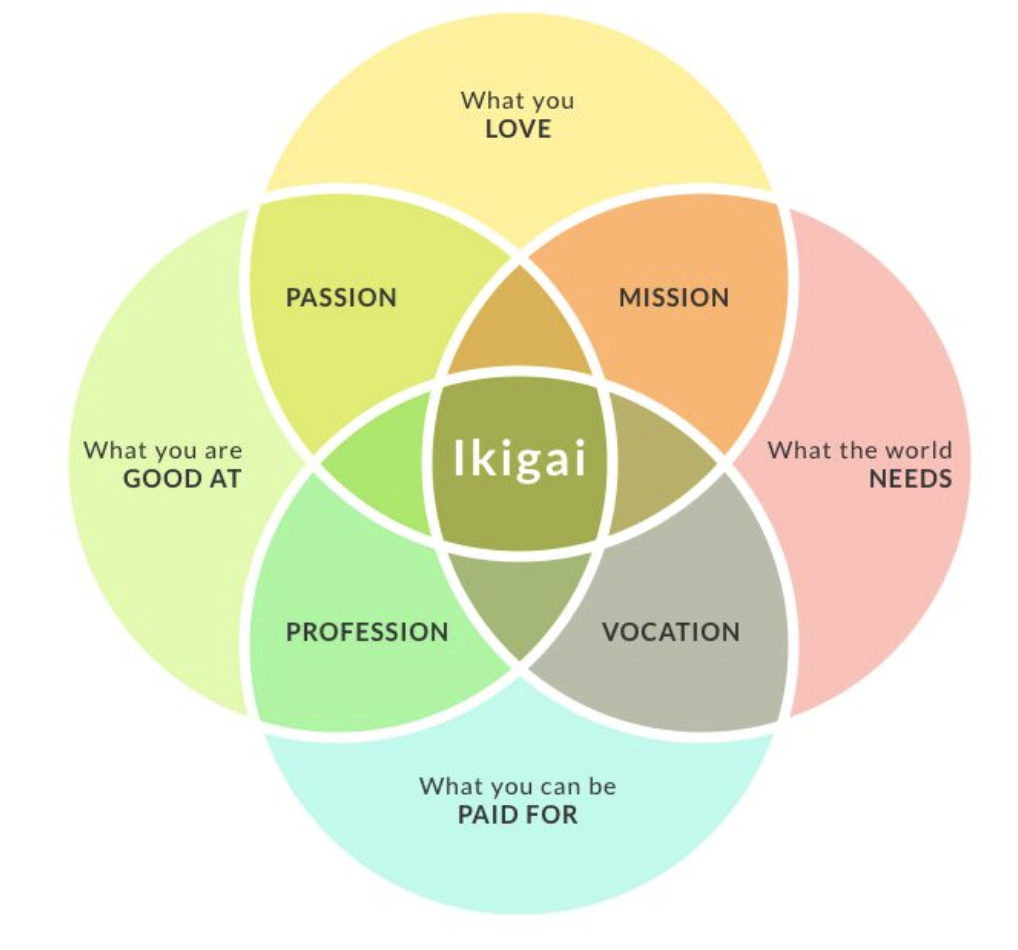
Venn diagram
Multiple overlapping circles
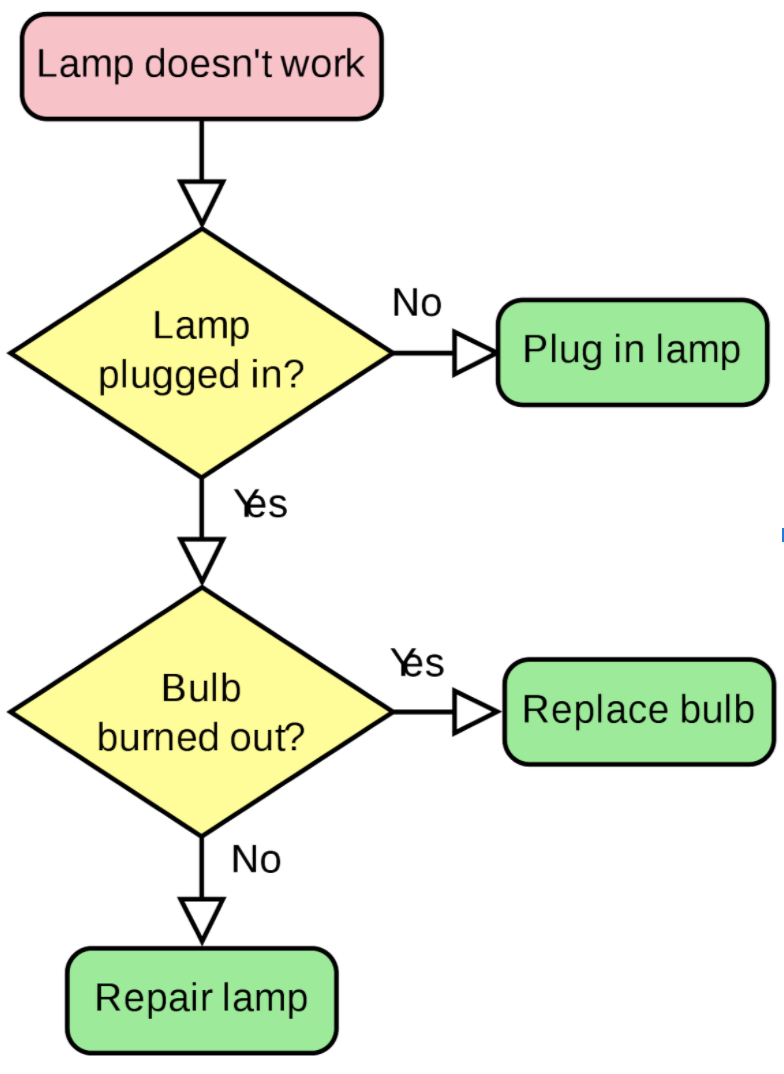
Flow chart
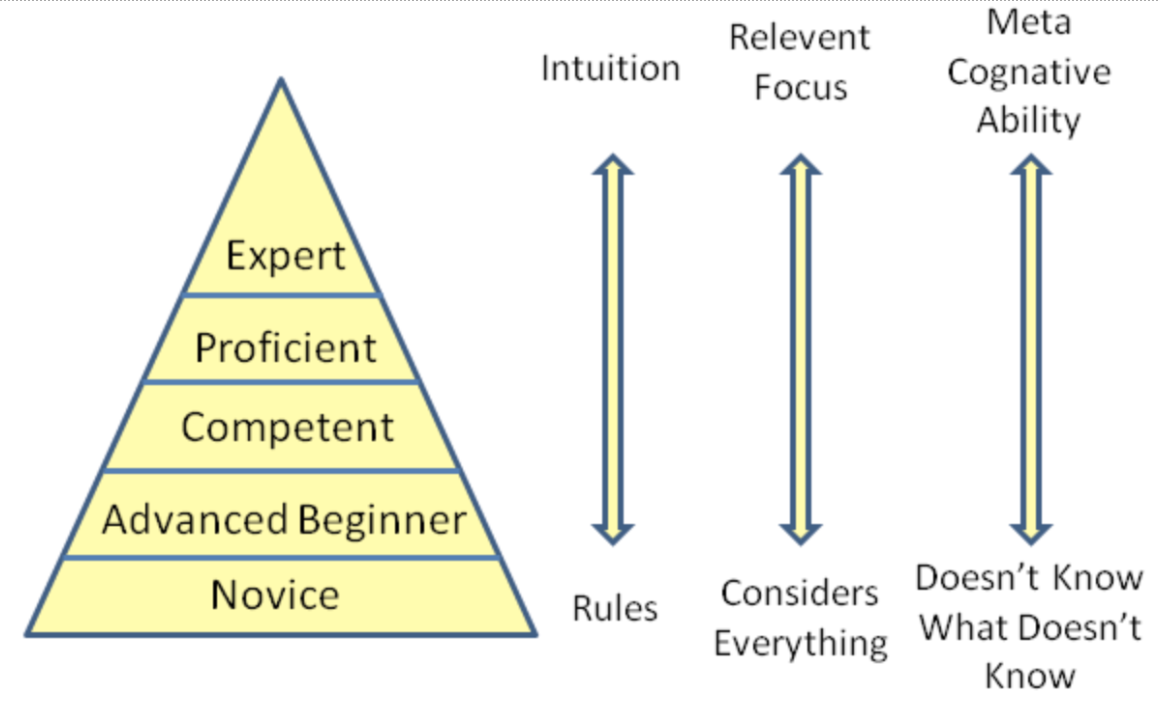
Stacked pyramid
2 axes with 1 variable
2 axes with 2 variables
3 axes with multiple variable
Places different solutions on multiple outcomes
Custom stuff.
3D explanations - don’t be one dimensional
I often try to explain things from three different perspectives: 1. Words, 2. In an equation and 3. Visually (what this blog is on)
I find that the three approaches normally allow new emergent ways of understanding / solutions. It’s so awesome!
So it looks something like this:
1=1. Just using words to explain
1+1=3. Using words and equation to explain
1+1+1=6. Using words, an equation and a visualisation to explain.
+++++++++
Details
Writing as thinking vs Writing as communicating
Yes of course writing is communication. I used to think that writing was like doing an English essay, one wrote out what one already thought. This can be the case, but to me I also find that that writing can be to figure out what you think. In fact, writing is the primary approach I use to figure out what I think / develop my thoughts.
Now, if there is a problem I don’t understand as much as I’d like to I ‘just start writing about it’ and slowly I figure things out. Link
This blog hopefully makes some sense and has reasonably cohesive order… it sure as hell doesn’t start like that. I just wrote myself a note saying ‘visualising ideas helps you develop and understand ideas better’.
For me, writing = high quality thinking…
… but ‘writing’ isn’t just words, it’s also making models / equations, taxonomies… and making visualisations (and more).
Visualisations as thinking vs Visualisations as communicating
I now set myself a challenge, make a visualisation of the core parts of the problem you are trying to solve. You’ll see that many of these blogs have visuals.
Most ideas are constantly evolved. You have your current best version of what to do until you upgrade it further. I normally think of this in generations. This means that most ideas can be improved indefinitely. Unlike school, IMO for the best ideas you can’t get ‘100%’ on them. Examples:
How to give feedback on this point to someone?
How to make a Year 7 Maths resources as awesome as possible?
How to be a good friend?
Who does the best egg and bacon combo?
I’ve found that making a visualisation levels up my understanding of a problem / solution:
Making visualisations is often a higher order thinking where concepts and ideas can be manifested. If I can’t visualise an idea in some way, I normally don’t have a strong enough understanding
Visualisations = abstracting reasoning = creativity in problem solving
They teach you to read and write in cursive at school, IMO they should teach you to communicate through visuals :).
If the future of work is ‘knowledge work’ then it’s taking ideas to reality. If visualising significantly helps you understand a problem. Then visualisation is a core way to make ideas (fantasies) into realities.
1,000 words can be crap or mind bending. A visualisation can be confusing or blow your mind
IMO there is no limit to the quality of words. IMO the difference between 1,000 good and 1,000 great words is 100x.
IMO there is no limit to the quality of visualisations. IMO the difference between a good visual and a great visual is 100x.
People say ‘you should learn to code’. Well I think you should learn to code if you are going to be a developer.
If you are a communicator (you are you communicate with yourself and other people), then I think you should learn to communicate in visuals.
Communication with Words + Visuals > Communication with Words only
Problem Solving with Words + Visuals > Problem Solving with Words only
Examples of visualisations
Continuum
One variable

Many variables that relate on a continuum.

Golden mean - good in the middle and bad on the ends

Table


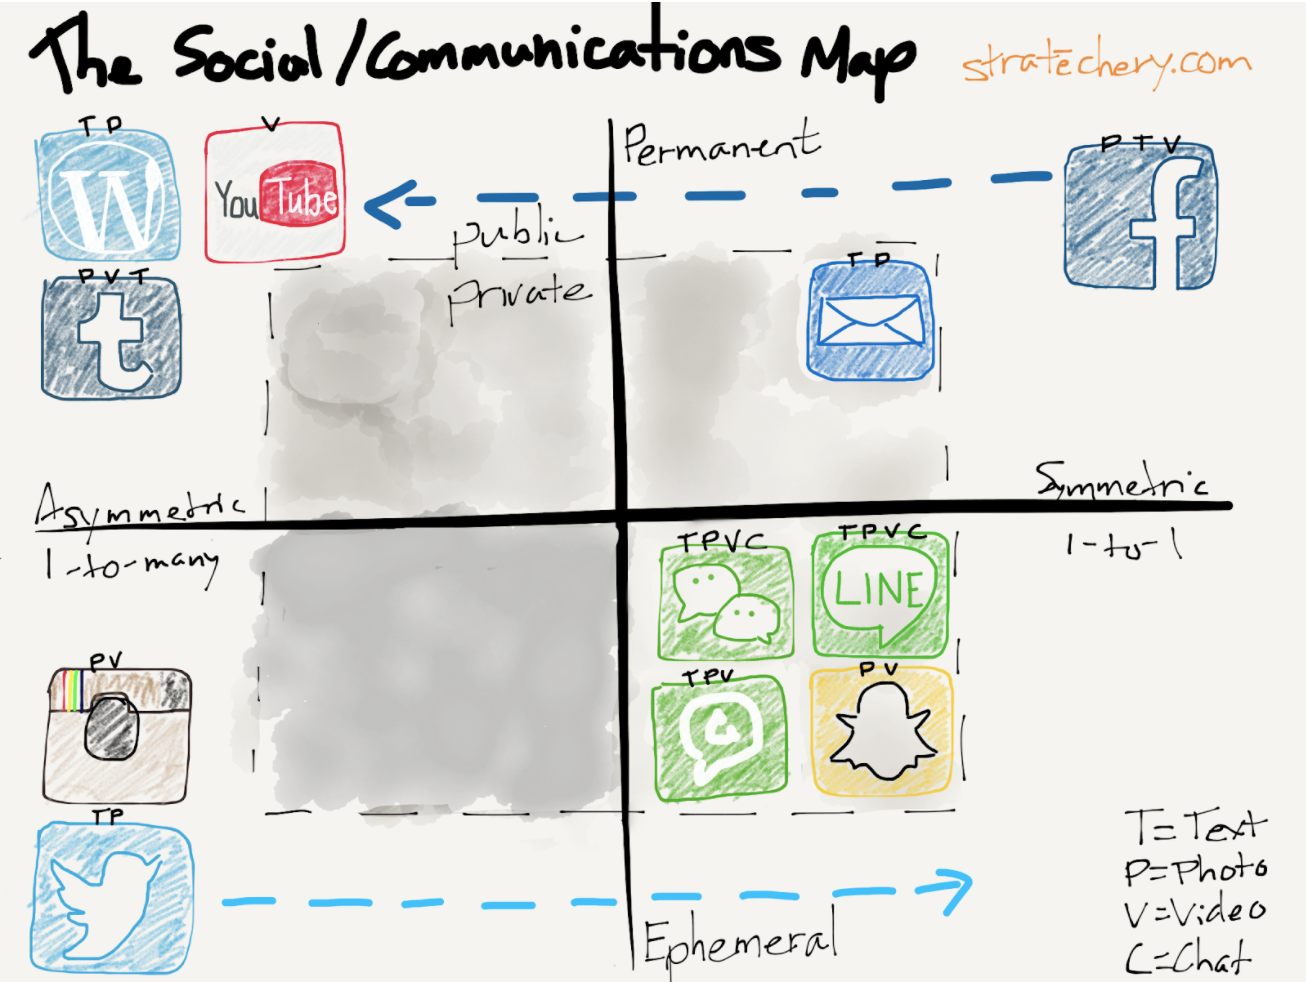
2x2

Concentric circles

Venn diagram

Multiple overlapping circles
Flow chart
Stacked pyramid


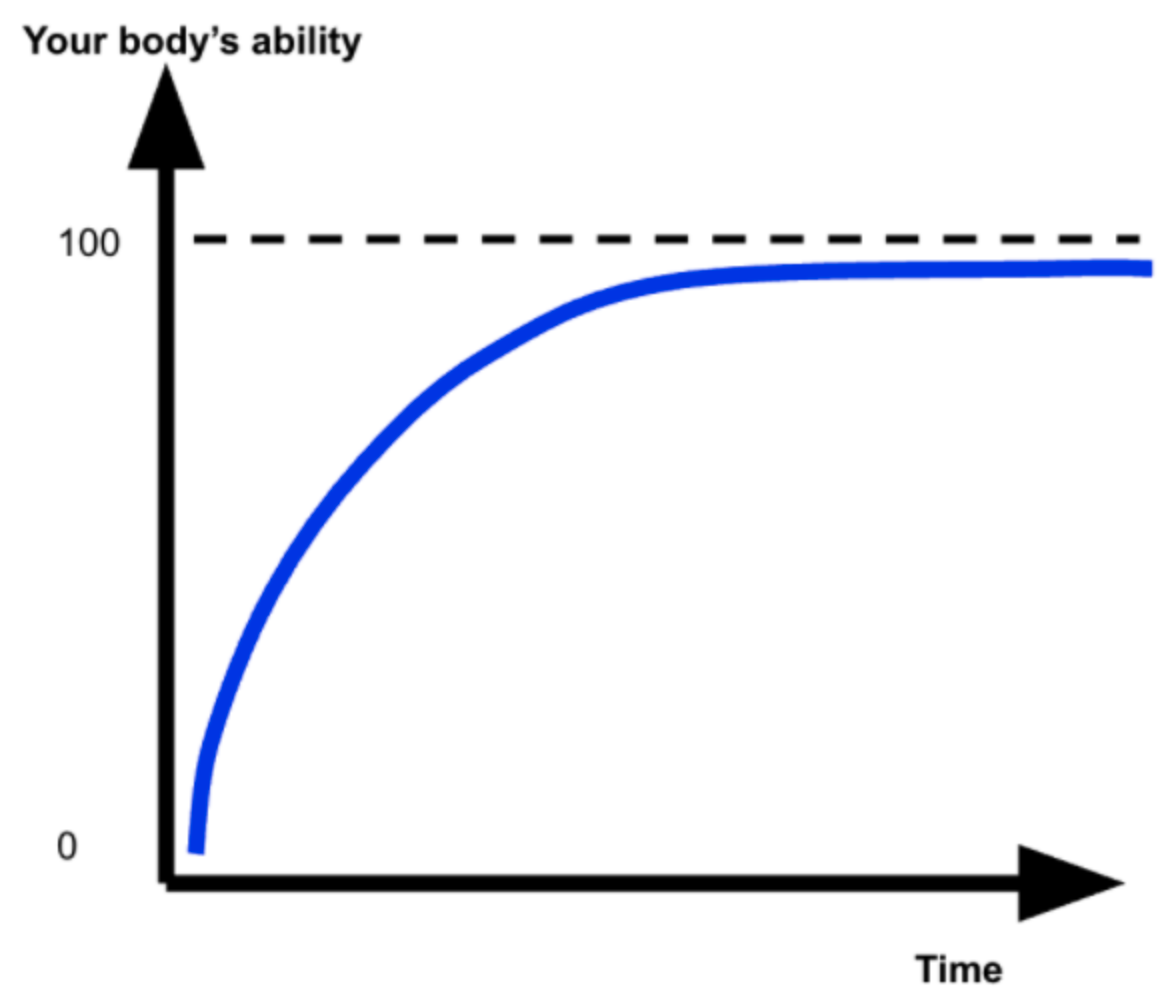
Chart with 2 axes with variables moving
One variable straight line

2 variables straight line

1 variable not straight line but with areas

Joining two visual models
Juxtapose two visual models

Placing different outcomes on 2 axes
Custom stuff


If you only take away one thing
Building visuals = problem solving
Building visuals = one key form of communication
Want to problem solve and communicate better? Get good at making visualisations.